Cutting down memory usage on my Sailfish app
Submitted by blizzz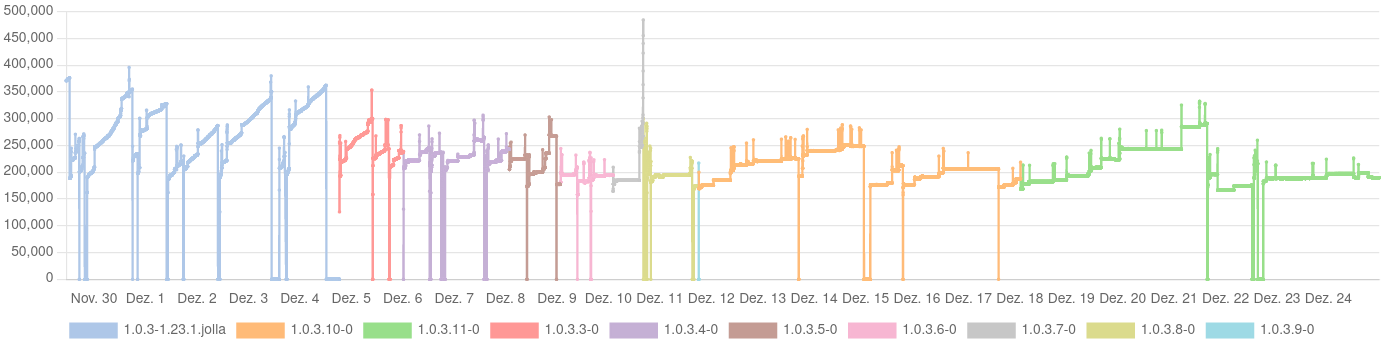
For a while the growing memory usage of my Nextcloud Talk app for SailfishOS was a kept in the back of my head. For the longest time the potential leak was an occasional observation: when looking which apps or processes may hoard memory. My app was never slim, and it looked it would only grow in RAM usage.
So this was a problem I wanted to tackle for a bit, although I was lacking tooling (was already digging there without much success) and in depth understanding of the technology used (after all it is a side project with pragmatic goals with very limited time resources).
Then, the other day Volker Krause blogged about best practices on working with the QNetworkAccessManager. Suddenly, reasons for the memory leaks were all to clear, and a path out laid out nicely.
Situation overview
Now, before rushing to the IDE, it would be nice to first have an overview about the current state. Not just to proof I have the leak, but how it actually manifests. Data, in other words. This would allow me also to compare my approaches and also evaluate my intermediate results.
And so at the beginning there was a script. This script would run minutely, controlled by a systemd timer. When it runs, it collects used memory by my app, and uploads it along with the app version to my Nextcloud Analytics. Of course the script could be more complex, but it does its job pretty well, and I had no case to make it more complex. I put into a repository on Codeberg, with brief instructions.
The memory usage is read from the total value of the pmap output, after finding the main process ID. While reading up on this matter, I also stumbled across this blog by Milian Wolff, doing something similar with pmap and gnuplot. This was assuring and inspiring.
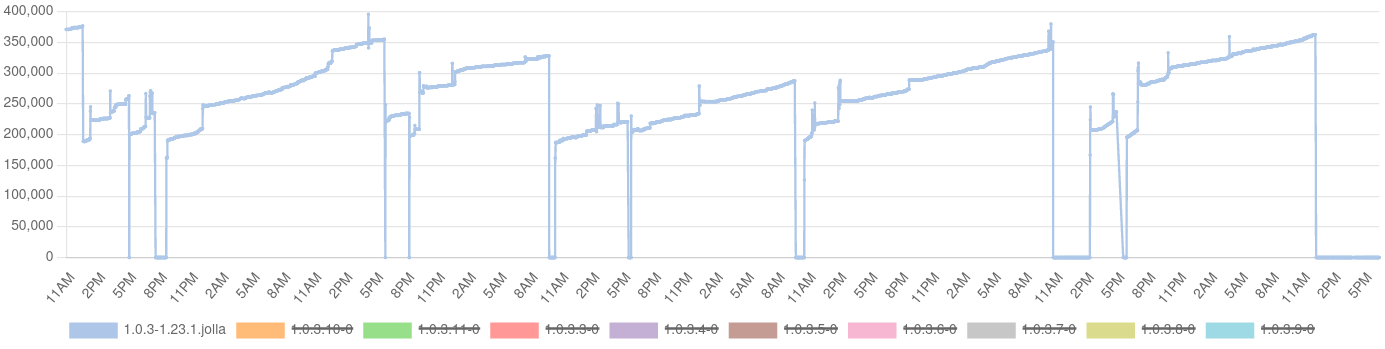
The result was: a saw tooth. Memory consumption would go up steeply and linearly. And every time again when starting the app (0 values mark the time when the app is not running).
It is also noteworthy that the app may have stopped for three reasons:
- Killed by the low-memory killer
- Crashed in a network switch case
- Manually stopped (seldom)
On my device, it is quite common that the low-memory killer is taking action, although, frankly, I never actively looked for this (other apps suffer as well, my phone has too little memory). The thing is: with a small memory footprint, this can be made unlikely, too. The crash of 2) would frequently happen when leaving WiFi and going mobile. The typical scenario is going out to pick up C2 from day care.
Iterative fixes
Now that I have both a checklist for the changes, a tool good enough for measuring the RAM usage, and the data to work against, I could take a little slice of time per evening and work on bit by bit to change my code and see the effects it takes.
I was starting with those areas where I expect that most RAM usage is coming from. So I could ensure that I am actually taking steps in the right direction, first, and secondly look out for regressions by dog-fooding.
During the whole process I was having nine builds in action. When I could, i would change a component a night, and do a build. I had regressions, due to changes in event handling: I used to have an instance of QNetworkAccessManager per component and would connect to the finished signal of it. First I wrongly continued with that and tried to differentiate by setting a custom property to the corresponding QNetworkReply, until I figured out that the QNetworkReply actually emits the finished signal itself.
By-catch
While working at the code, and also consuming a good share of Qt documentation, very happily I also figured out where the network-dependent crash happened and could fix it just as well. This was annoying me so much for such a long time, but the crash never left any traces.
Results
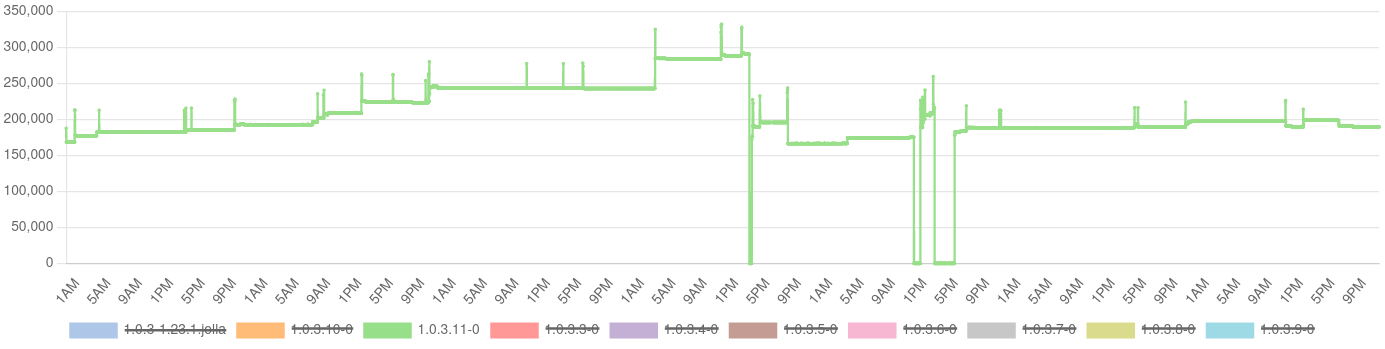
I could reduce the average memory consumption by 25%, from more than 266 MB down to about 200 MB. The peak fell from 387 MB down to 325 MB, down about 16%. The median went from 267 MB to 189 MB, reduced by about 30%. A very nasty bug was fixed, disk caching was enabled to reduce some network traffic, and I learnt an awful lot again :) The numbers are of course specific to my usage. I have three accounts connected, two work related and a family one. The main work account is a high traffic one. In off hours I am typically on DND, or have them temporarily disabled.
I am also confident enough to use the oom_adj knob to prevent my app being terminated by the low-memory killer, being one of two apps I actually do not want to be stopped on my smartphone. The commits are are collected in this pull request.
Not all leaks are addressed, however, but the scale is totally different. The saw tooth is gone, the remaining slow rise is not related to QNetworkAccessManager anymore, but apparently not everything is cleaned up when leaving a conversation view (the spikes indicate having entered a conversation).
The changes done here are shipped with version 1.0.4.
Trivia
The other day I have asked Carl for a proof read of this blog (thank you!). It turned out, that he took some of this code for the Tokodon app (a KDE Mastodon client). Eventually, Volker fixed some bits of the networking code, resulting in his aforementioned blog post. And here we are again :D
Add new comment